
Continuous visibility of servers, network devices, storage, databases and branch infrastructure — with alerting tuned so it means something, and dashboards built for the people who have to make decisions from them. Monitoring that produces noise is worse than no monitoring, because it teaches people to ignore alarms.
The platforms

Zabbix
Infrastructure and network monitoring. Enterprise-grade coverage across servers, network, storage and databases — sized, tuned and escalation-mapped for your estate.
Product page →

Grafana
Dashboards and observability. Executive and operational views built from the data you already collect, on your infrastructure.
Product page →
Both are open source and both are downloadable today without speaking to us. If you want to read the projects’ own material before reading ours, the links are here.
Visit the Zabbix website
The official site of Zabbix LLC, the company behind Zabbix. Opens in a new tab — hold Ctrl (⌘ on a Mac) or middle-click to keep it in the background.
www.zabbix.comVisit the Grafana website
The official site of Grafana Labs, which leads the Grafana project. Opens in a new tab — hold Ctrl (⌘ on a Mac) or middle-click to keep it in the background.
grafana.com/oss/grafanaAlerts that become work
This is the join most organisations never make: monitoring detects a problem, and the work to fix it is tracked somewhere else entirely — usually email, chat, or somebody’s memory.
We close that loop. When monitoring raises an incident, an item is created automatically in your delivery or service platform, assigned to the right team, with severity mapped to your priority scale and the alert context attached. When the item is resolved, the loop is closed back. Nothing depends on somebody remembering to write it down.
- Integration build. API and webhook integration between the monitoring platform and your delivery or service platform.
- Severity mapping. Monitoring severity mapped to your priority and SLA matrix, agreed with your teams rather than assumed.
- Routing rules. Which alert types create items in which project or queue, assigned to which team.
- Context enrichment. Host, metric, threshold and history attached to the created item so the responder has what they need without going back to the console.
- Loop closure. Resolution in the delivery platform acknowledged back to monitoring, so the two systems agree on state.
What good monitoring looks like
Two failure modes account for most disappointing monitoring deployments. The first is monitoring everything at default thresholds, which produces alert volume nobody can triage. The second is never deciding who is woken up for what, so alerts arrive somewhere and stop.
We design against both. Thresholds are baselined against your observed behaviour, dependencies are configured so one failure produces one alert rather than forty, and the escalation matrix is agreed with your operations team before go-live rather than after the first bad night.
Once it is tuned
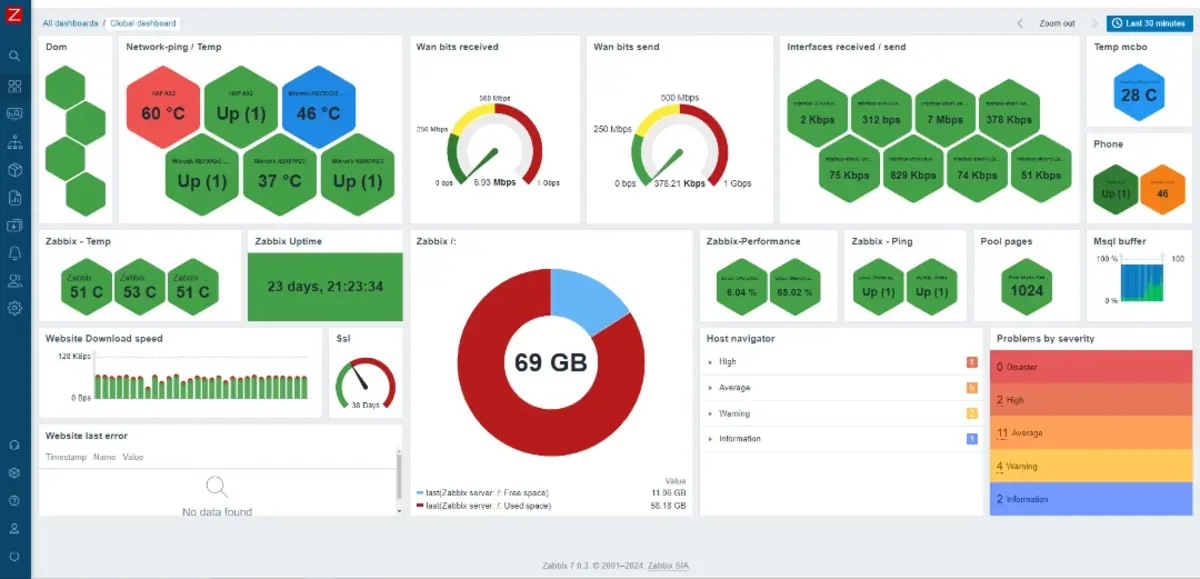
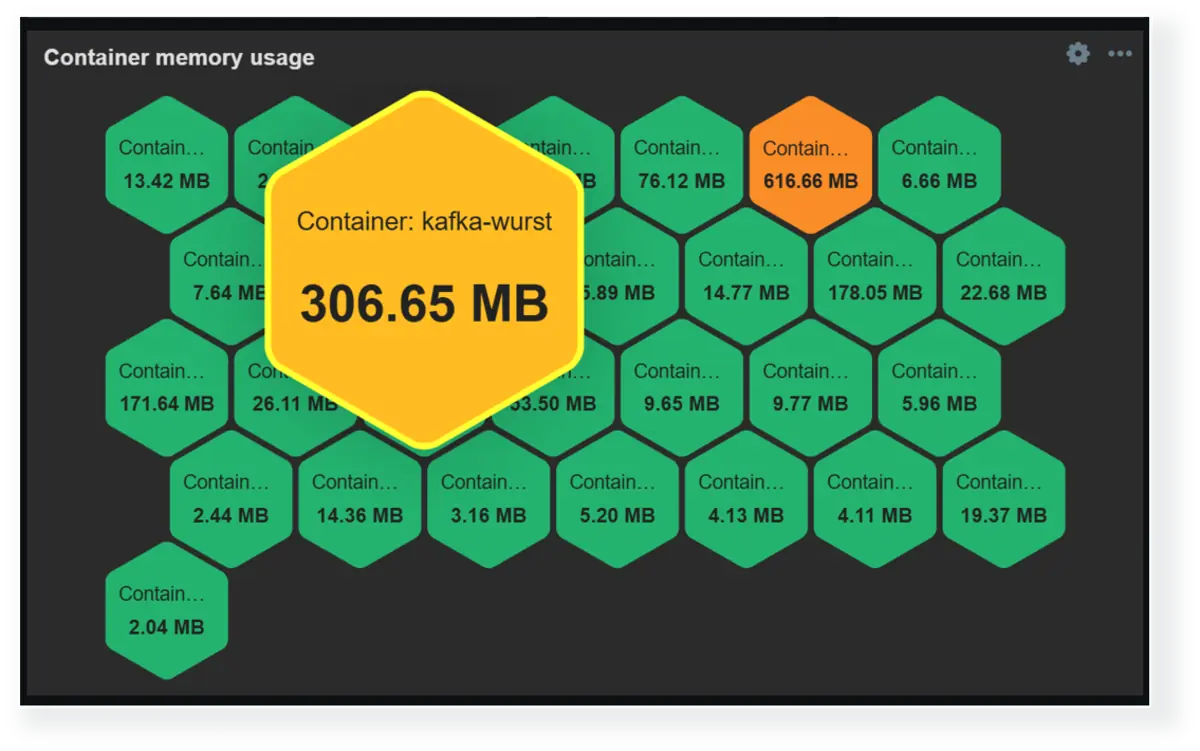

Screenshots from the Zabbix project. Zabbix is a registered trademark of Zabbix LLC.