

Visit the Zabbix website
The official site of Zabbix LLC, the company behind Zabbix. Opens in a new tab — hold Ctrl (⌘ on a Mac) or middle-click to keep it in the background.
www.zabbix.comZabbix is enterprise-grade infrastructure monitoring — servers, network devices, databases, applications, storage and environmental sensors, with thresholds, trend analysis and escalation built in. It scales from a single data centre to a national branch network.
Most monitoring deployments fail for the same two reasons: everything is monitored at default thresholds so alerts become noise, and nobody defined who is woken up for what. We deploy Zabbix properly — templates matched to your equipment, thresholds set against your actual baselines, and an escalation matrix agreed with your operations team before go-live.
Who it’s for
Operations teams responsible for keeping infrastructure available and evidencing that they did.
- Bank IT operations covering core systems, branch networks and ATM estates
- Data-centre and infrastructure teams monitoring servers, storage, virtualisation and network fabric
- Organisations with uptime commitments to the business or to regulators
- Teams that currently learn about outages from users rather than from a monitoring system
What we deliver
A monitoring platform tuned to your estate, with alerting people trust enough to act on.
Installation and sizing
Server, proxy and database tiers sized for your host and item count, deployed inside your network.
Distributed proxies
Zabbix proxies at remote branches and data centres so monitoring survives WAN interruption and reports centrally.
Template configuration
Official and custom templates for your servers, network devices, hypervisors, storage and databases.
Threshold baselining
Thresholds set against observed behaviour rather than defaults, so alerts mean something.
Escalation design
Who is notified, after how long, and who it escalates to — agreed and configured, including out-of-hours paths.
Database monitoring
Replication lag, connection saturation, slow queries, backup job success and disk headroom surfaced as first-class checks.
Ticket integration
Alerts raise tickets automatically in your service desk or issue tracker rather than generating email nobody owns.
Training and handover
Operator, administrator and template-authoring training.
What we monitor
- Linux servers
- Windows servers
- VMware / Proxmox / Hyper-V
- Network devices (SNMP)
- PostgreSQL
- MySQL / MariaDB
- Microsoft SQL Server
- Apache / Nginx / Tomcat
- Storage arrays
- UPS and environmental sensors
- Application endpoints (HTTP, TCP, custom)
On-premises versus cloud
Every criterion below is one your auditors will ask about. This is why we deploy inside your network by default.
| Criterion | On-premises, on your infrastructure | Public cloud / SaaS |
|---|---|---|
| Security | You control the firewall, the encryption keys, the access policy and the audit trail. | Shared infrastructure and a provider-defined security boundary. |
| Privacy | Data never leaves your network perimeter. | Data is stored and processed on third-party systems under their terms. |
| Autonomy | Full customisation, your upgrade schedule, no vendor lock-in. | Provider-driven roadmap and forced upgrade windows. |
| Integrity | You define backup, retention and recovery, and you test them. | You inherit the provider’s backup policy and their definition of acceptable loss. |
| Continuity | Service survives loss of internet connectivity; it runs on your intranet. | An outage or a commercial dispute at the provider becomes your outage. |
| Cost | Capital cost plus support; no per-seat escalation as headcount grows. | Per-user subscription that grows with your organisation. |
Monitoring data is a live map of your infrastructure topology, capacity and weaknesses. Sending it to a third party is a decision worth making deliberately.
How it connects to the rest of your stack
Nothing we deploy is meant to stand alone. These are the joins we build as part of the same engagement.
- Dashboards — Metrics feed Grafana for executive and operational dashboards without duplicating collection.
- Service desk — Alerts open tickets automatically, with severity mapped to your priority matrix.
- Project delivery — Incidents that need engineering work rather than a restart flow into the delivery backlog as tracked items.
- Database services — Where we also run your databases, monitoring covers replication health, backup success and recovery-point drift — not just whether the server is up.
Engagement summary
Questions we’re usually asked
How many devices can it handle?
Zabbix scales to tens of thousands of monitored hosts with correct sizing and proxy distribution. Sizing is part of the assessment — we would rather specify it against your real estate than quote a headline number.
Can it monitor our branch network over an unreliable WAN?
Yes. A Zabbix proxy at each branch collects locally and buffers, so a WAN interruption delays reporting rather than creating a monitoring gap.
What about alert fatigue?
This is the failure mode we design against. Thresholds are baselined against observed behaviour, dependencies are configured so one failure does not generate fifty alerts, and escalation paths are agreed with your team before go-live.
Zabbix in use
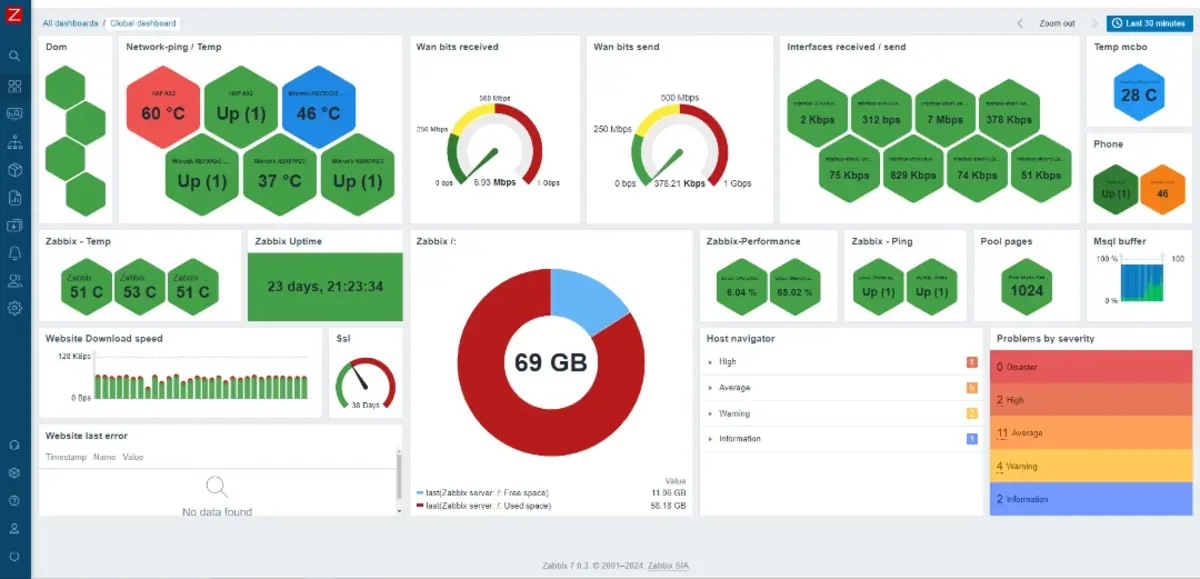
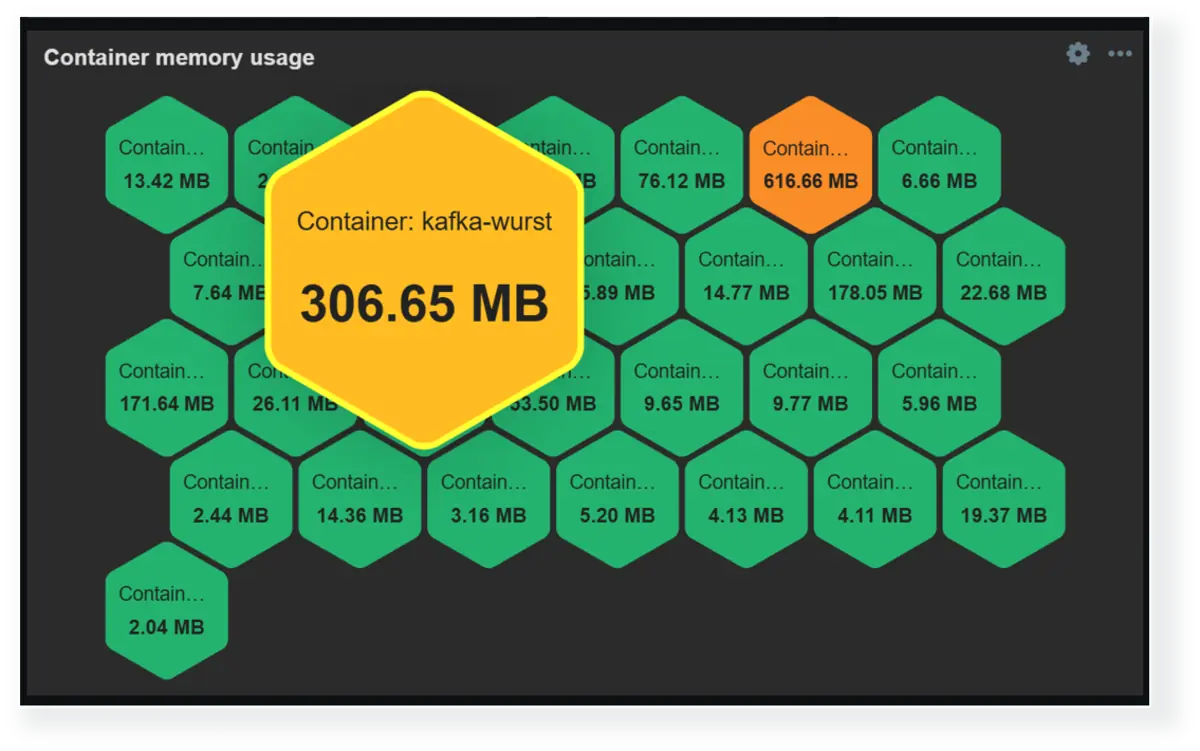


Screenshots from the Zabbix project, shown to illustrate the platform we deploy and configure.